Scroll tracking with Google Tag Manager
There is a great deal we can do with GTM: installing third-party tags, tracking file downloads, or measuring how far down a reader got.

Jakub Gombár
Co-Founder
25. April 2018
9 min
IntermediateThere is a great deal we can do with GTM: installing third-party tags, tracking file downloads, or measuring how far down a reader got.
Jakub Gombár
Co-Founder
25. April 2018
9 min
IntermediateA note first:
Before you start reading about scroll tracking and GTM, I recommend looking at my earlier articles, where I introduced GTM and its features. If you already have the basics down pat, we can stride confidently on to more advanced implementations with Google Tag Manager. So, straight into it...
We can certainly set up scroll tracking from GTM's predefined triggers and variables, but this post is about deploying it through custom HTML code, which has served us well.
There is a great deal we can do with GTM, from installing third-party tags to tracking file downloads or measuring how far a person on our site actually read.
In this article we will explain how to send specific events to Google Analytics recording how far people scroll down the page. To begin with, it is worth asking a simple question...
Google Analytics has some metrics that matter rather less than one might think, such as bounce rate or how long someone spent on our page. Those metrics do not tell us the whole story that this kind of tracking can.
Say we use time on page as a metric — what does it mean if someone spends 10 minutes on our page? It is certainly a good thing, but it tells us nothing about how the content was received. Questions of this sort go unanswered: Is the content interesting? Did the visitor find what they were looking for?
Bounce rate has similar problems. If a visitor lands on the contact page and leaves immediately, we cannot claim they found the information they were after. That example only underlines how important tracking goals and conversions in Analytics is. One answer is the good, proven tool Hotjar, which I personally find well suited to recording user behaviour.
Whatever these examples show, I think it is clear that we cannot rely on bounce rate alone or on time spent on the page as engagement metrics. This is where scroll depth comes in.
The ability to track scroll depth (my version at least — other methods exist) involves a plugin created by Rob Flaherty. This plugin, which uses jQuery to record data in GA, sends events to Google Analytics at various points on the page — Baseline (0%), 25%, 50%, 75% and 100% — each marking a different point relative to the top and bottom of the page.
There are a few requirements we have to meet to complete this guide:
The first thing we have to do is go to the website in GTM and find the container we want to work in.

Before we create our tag, I recommend creating a trigger that ensures the scroll-depth script fires once the DOM is ready.
What is the DOM? Well, that is a rather good question! It stands for Document Object Model and represents all the things — tags, divs, list items — in an HTML document. The DOM provides a way for JavaScript to work with all those "nodes". The DOM trigger we create means the tag fires once the browser has finished building the whole page DOM.
To create the trigger we go to the "triggers" section in GTM.

Here we click the "new" button. We label our trigger "DOM Ready" and add the DOM Ready trigger from the page view section.
The trigger should look much like the one below:

Before moving on to the next step, we click "Save".
Next we will need a new tag. We click "tags" in the left-hand menu:

Here we click "new" and choose "Custom HTML".

Then we should go to the following URL and copy the whole scrolldepth.js file:
<script>
/*!
 * @preserve
 * jquery.scrolldepth.js | v0.4.1
 * Copyright (c) 2014 Rob Flaherty (@robflaherty)
 * Licensed under the MIT and GPL licenses.
 */
;(function ( $, window, document, undefined ) {

  "use strict";

  var defaults = {
    elements: [],
    minHeight: 0,
    percentage: true,
    testing: false
  },

  $window = $(window),
  cache = [];

  /*
   * Plugin
   */

  $.scrollDepth = function(options) {

    var startTime = +new Date;

    options = $.extend({}, defaults, options);

    // Return early if document height is too small
    if ( $(document).height() < options.minHeight ) {
      return;
    }

    // Establish baseline (0% scroll)
    sendEvent('Percentage', 'Baseline');

    /*
     * Functions
     */

    function sendEvent(action, label, timing) {
      if (!options.testing) {

        if (typeof(dataLayer) !== "undefined") {
          dataLayer.push({'event':'ScrollDistance', 'eventCategory':'Scroll Depth', 'eventAction': action, 'eventLabel': label, 'eventValue': 1, 'eventNonInteraction': true});

          if (arguments.length > 2) {
            dataLayer.push({'event':'ScrollTiming', 'eventCategory':'Scroll Depth', 'eventAction': action, 'eventLabel': label, 'eventTiming': timing});
          }
        } else {

          if (typeof(ga) !== "undefined") {
            ga('send', 'event', 'Scroll Depth', action, label, 1, {'nonInteraction': 1});

            if (arguments.length > 2) {
              ga('send', 'timing', 'Scroll Depth', action, timing, label);
            }
          }

          if (typeof(_gaq) !== "undefined") {
            _gaq.push(['_trackEvent', 'Scroll Depth', action, label, 1, true]);

            if (arguments.length > 2) {
              _gaq.push(['_trackTiming', 'Scroll Depth', action, timing, label, 100]);
            }
          }
        }

      } else {
        $('#console').html(action + ': ' + label);
      }
    }

    function calculateMarks(docHeight) {
      return {
        '25%' : parseInt(docHeight * 0.25, 10),
        '50%' : parseInt(docHeight * 0.50, 10),
        '75%' : parseInt(docHeight * 0.75, 10),
        // 1px cushion to trigger 100% event in iOS
        '100%': docHeight - 1
      };
    }

    function checkMarks(marks, scrollDistance, timing) {
      // Check each active mark
      $.each(marks, function(key, val) {
        if ( $.inArray(key, cache) === -1 && scrollDistance >= val ) {
          sendEvent('Percentage', key, timing);
          cache.push(key);
        }
      });
    }

    function checkElements(elements, scrollDistance, timing) {
      $.each(elements, function(index, elem) {
        if ( $.inArray(elem, cache) === -1 && $(elem).length ) {
          if ( scrollDistance >= $(elem).offset().top ) {
            sendEvent('Elements', elem, timing);
            cache.push(elem);
          }
        }
      });
    }

    /*
     * Throttle function borrowed from:
     * Underscore.js 1.5.2
     * http://underscorejs.org
     * (c) 2009-2013 Jeremy Ashkenas, DocumentCloud and Investigative Reporters & Editors
     * Underscore may be freely distributed under the MIT license.
     */

    function throttle(func, wait) {
      var context, args, result;
      var timeout = null;
      var previous = 0;
      var later = function() {
        previous = new Date;
        timeout = null;
        result = func.apply(context, args);
      };
      return function() {
        var now = new Date;
        if (!previous) previous = now;
        var remaining = wait - (now - previous);
        context = this;
        args = arguments;
        if (remaining <= 0) {
          clearTimeout(timeout);
          timeout = null;
          previous = now;
          result = func.apply(context, args);
        } else if (!timeout) {
          timeout = setTimeout(later, remaining);
        }
        return result;
      };
    }

    /*
     * Scroll Event
     */

    $window.on('scroll.scrollDepth', throttle(function() {
      /*
       * We calculate document and window height on each scroll event to
       * account for dynamic DOM changes.
       */

      var docHeight = $(document).height(),
        winHeight = window.innerHeight ? window.innerHeight : $window.height(),
        scrollDistance = $window.scrollTop() + winHeight,

        // Recalculate percentage marks
        marks = calculateMarks(docHeight),

        // Timing
        timing = +new Date - startTime;

      // If all marks already hit, unbind scroll event
      if (cache.length >= 4 + options.elements.length) {
        $window.off('scroll.scrollDepth');
        return;
      }

      // Check specified DOM elements
      if (options.elements) {
        checkElements(options.elements, scrollDistance, timing);
      }

      // Check standard marks
      if (options.percentage) {
        checkMarks(marks, scrollDistance, timing);
      }
    }, 500));

  };

})( jQuery, window, document );
jQuery.scrollDepth();
</script>
Once copied, we paste the code into the empty HTML field in GTM.
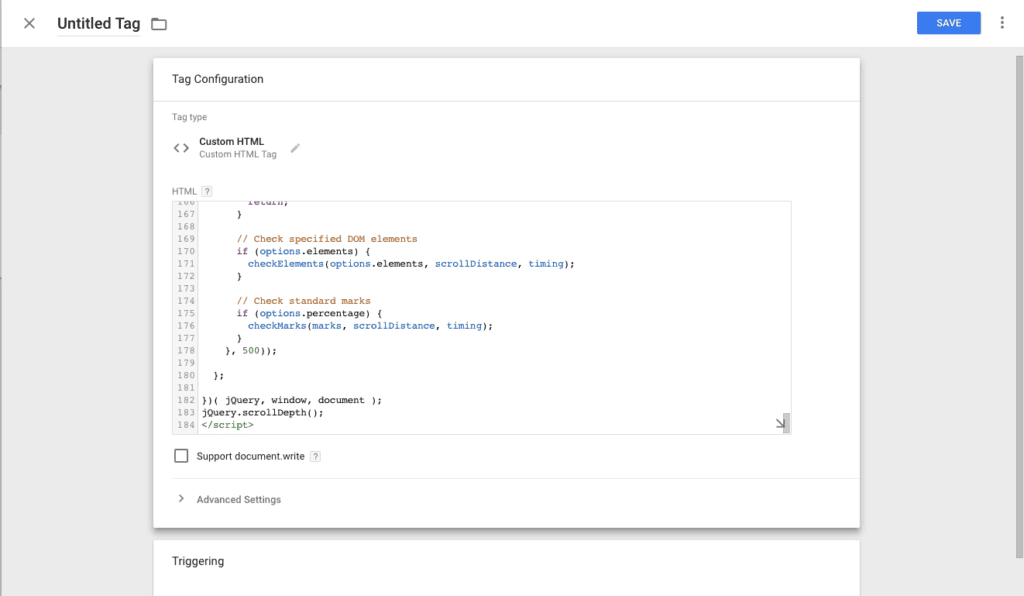
This script then creates the dataLayer and pushes a scroll tracking event into it every time it fires.
Events in GTM, however, are not connected through to Google Analytics. For that we need a separate tag in GTM to send the events to GA. We will create that shortly.
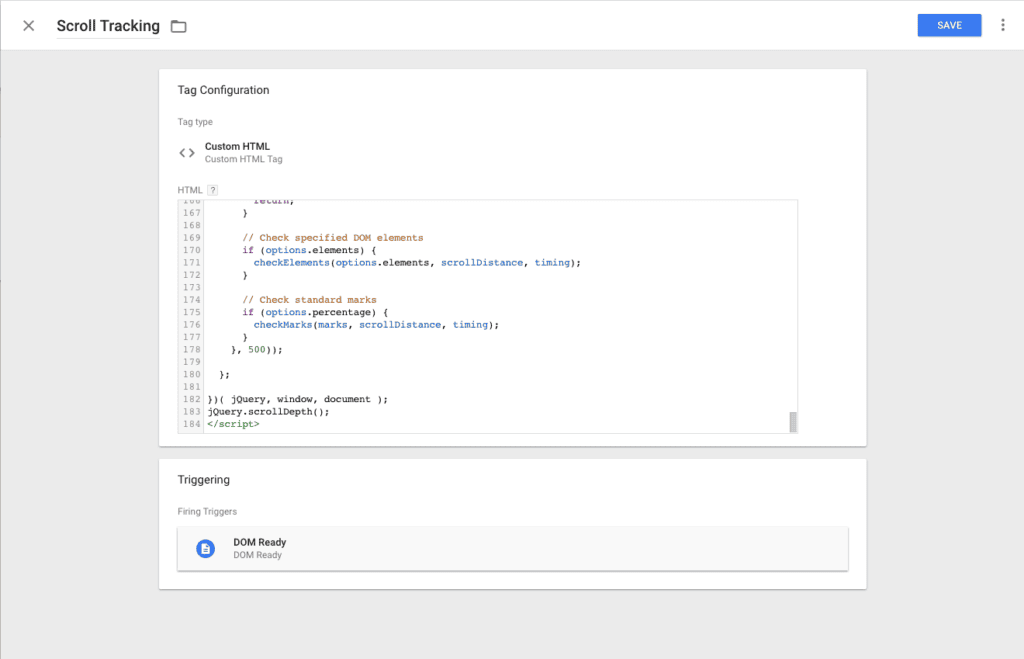
Having added the code above, we add the trigger we created earlier.
Our tag should look like the picture below. Finally we give it a name we can find our way around — in my case that will be "Scroll Tracking".
Next we need to create the variables that define the parts of the events, so we can send them to Google Analytics. Remember that events in GTM are not the same thing as events in Analytics.
Google Analytics events consist of four components: Category, Action, Label and Value. The last two are optional.
We create each of them as variables in GTM. Why? Because to send events from GTM to GA we have to define these components by pulling the information out of the dataLayer. Once those variables exist, we then create a Google Analytics tag set to event, which will then be sent on to Google Analytics.
To create new variables, we go to the relevant section from the choices on the left:

We click "new" and name our first variable "eventCategory". Choose the type "DataLayer Variable" and then enter the variable name as "eventCategory". Leave them on version 2. Click Save. Our variable should look like this:

We repeat these steps for the Action, Label and Value variables. For the variable name we use the following:
The screenshots below show how the following variables should look. It is important to keep these variable names exactly as written here.


Now that we have our variables, we can send the information our scroll-tracking JavaScript pushes into the dataLayer.
Let us go back to the tags section, click "New" and choose "Universal Analytics". We enter our Google Analytics ID (Tracking ID) here and choose "Event" as the type.
Now we have the option of entering the variables we have just created. Click the building block button to the right of each of the Category, Action, Label and Value text fields and choose the relevant variable:
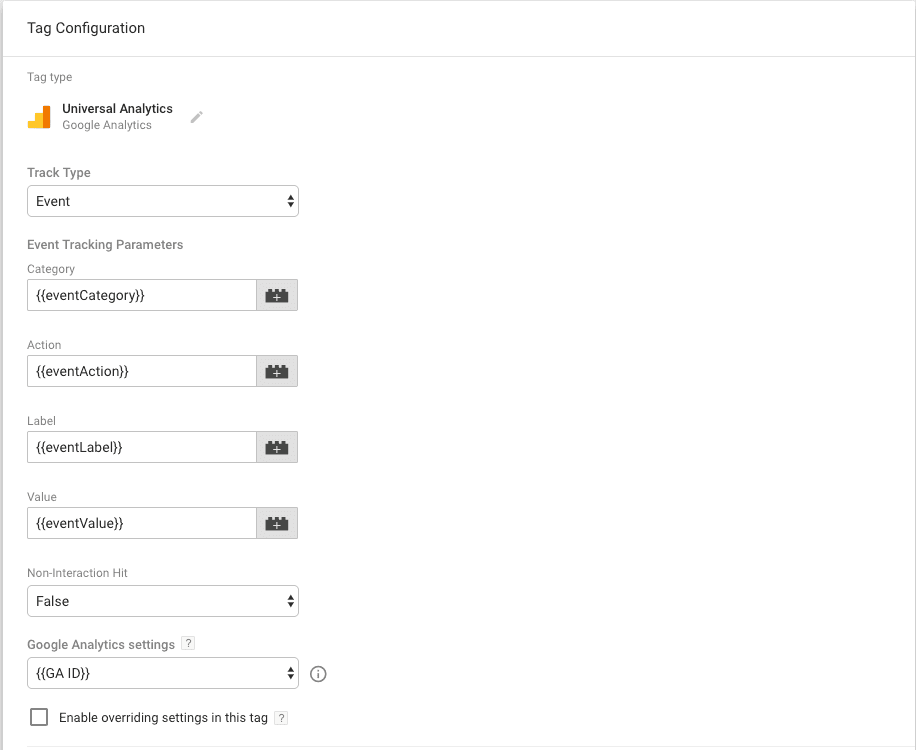
The last thing we have to do is set the trigger. We choose the "Custom Event" event, where the event name will be "ScrollDistance". We save this trigger and then save the tag as well.

When we enter Preview mode in GTM to check that our tag fires correctly, the preview window should contain these tags:

After a few hours we will be able to analyse the results of our scroll-tracking implementation in the events report in Google Analytics. To view the report we visit Google Analytics. We will have to go to the "Behaviour" reports in GA — specifically the events section:
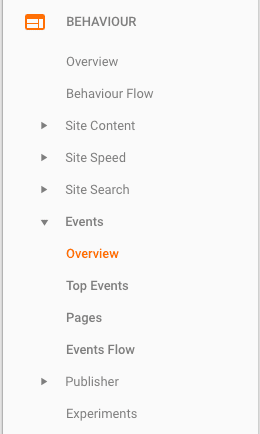
Once there, we see the events in charts, as in most other reports:

To get a breakdown of the events, we click "Event Label" under "Top Events" in the bottom left of the screen. We then get a breakdown like the one below:

Note: the views expressed in this article are the author's own.
Jakub Gombár
Co-Founder
The latest trends, proven practices and analyses from the digital world. Find out how to take your technology and marketing growth further.
And don't forget to check out Invelity Extras – you'll find a marketing glossary, useful tools and plugins to make your work easier!
Invelity Extras